
퍼블리싱을 배우던 때 개발자였던 지인과 스터디를 한 적이 있었습니다. 디버깅을 할 때 다마 크롬 브라우저 Souces 패널을 사용했는데 굉장히 유용해 보였습니다. 배워야지 하면서 계속 미뤄뒀었는데 이번 유휴 기간 동안 사용법을 익히면서 전반적인 기능을 정리하였습니다.
실행
크롬 개발자 도구(Chorme DevTools)의 Sources 패널에서 디버깅을 할 수 있습니다.
- 윈도우: F12/ ctrl + shift + i
- 맥: command + option + i
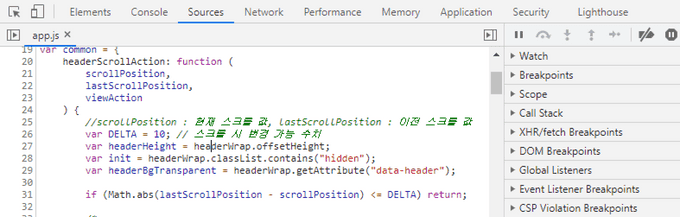
중단점(Breakpoint)
중단점을 설정 후 해당 이벤트를 발생하면 스크립트 실행을 일시 정지시키고 디버깅 모드로 진입합니다.
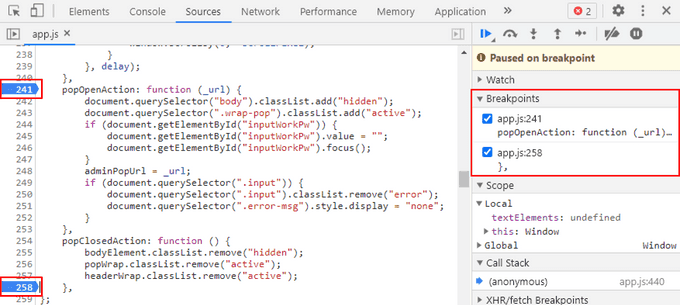
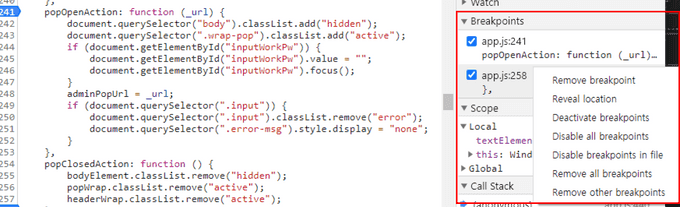
행 번호 클릭하여 중단점을 설정할 수 있으며 debugger 탭 Breakpoints에 내역이 생성됩니다. 이 탭 내에서 마우스를 우클릭하면 옵션이 노출됩니다.
Debugger 탭
탭에 마우스 호버를 하면 기능 명칭과 단축키가 노출됩니다.
순서대로 resume/ step over/ step into/ step out / step/ deactivate breakpoints/ pause on exceptions

resume script execution(F8)
스크립트 재실행
여러 개의 중단점이 있을 경우 각각의 중단점에서 멈추며 추가 중단점이 없을 경우, 디버깅은 종료되어 스크립트를 재실행시킵니다.
step(F9)
다음 코드를 한 줄씩 실행합니다.
step over next fuction call(F10)
다음 코드를 한 줄씩 실행합니다. 현재 실행에 함수가 있다면 함수 안으로는 들어가지 않습니다.
step과 step over next fuction call의 차이점
- step: 함수 호출 시 실행 후 함수 내부로 진입
- step over: 함수 호출 시 실행은 하지만 함수 안으로 진입하지 않음 (내용에 대해 디버깅을 하지 않아도 될 때 쓰임)
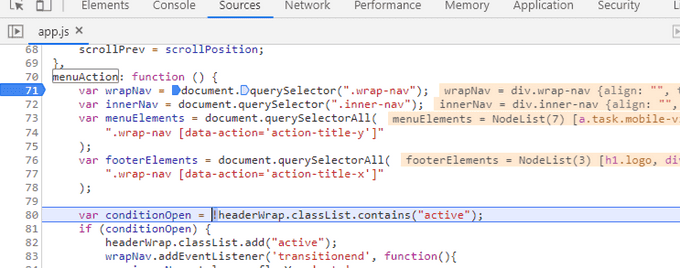
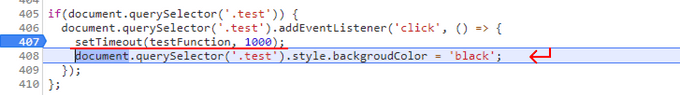
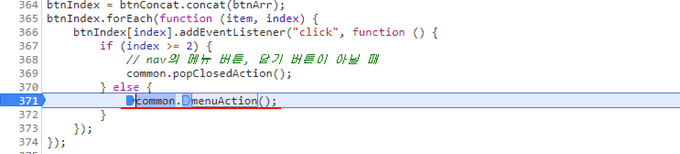 함수에 중단점 설정 후 이벤트 실행
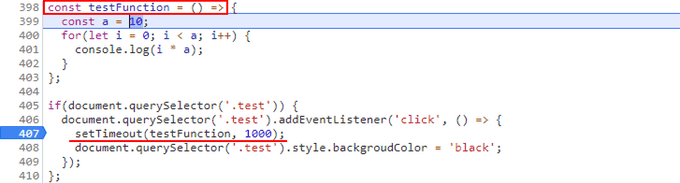
 step) 함수 내부로 진입 후 코드 실행
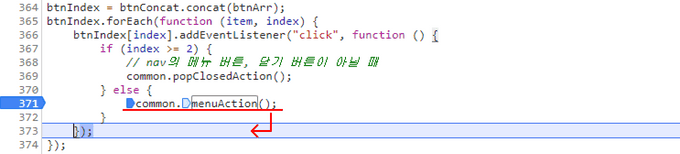 step over) 함수 내부로 진입하지 않고 다음 코드 실행
step into next function call(F11)
다음 코드를 한 줄씩 실행합니다. 현재 실행에 함수가 있다면 함수 안으로 들어가 실행합니다.
step과 step into next function call의 차이점
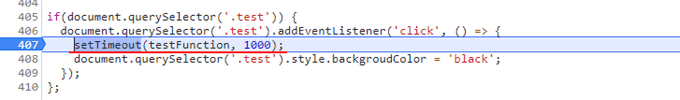
- step: 비동기는 실행하지 않음
- step into: 비동기 코드로 진입
step out of current function(shift + F11)
현재 실행 중인 코드에서 빠져나옵니다.
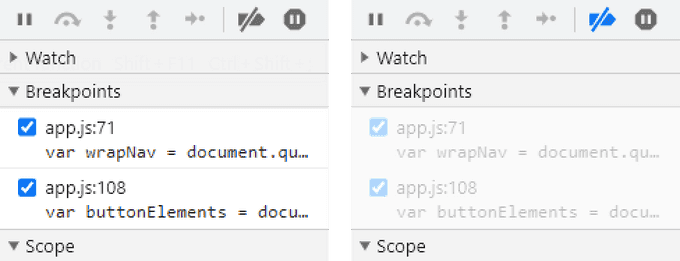
deactivate breakpoints(ctrl + F8)
모든 중단점을 일시적으로 활성화 혹은 비활성화 합니다.
pause on exceptions
스크립트 실행 중 오류가 발생을 하면 실행이 멈추고 오류가 난 부분을 표시합니다.
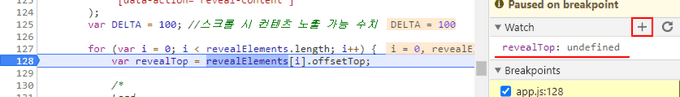
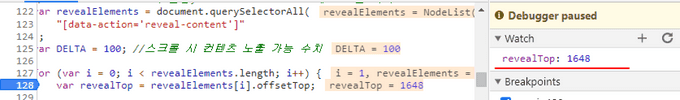
Watch
’+’ 버튼을 클릭해 변수나 객체를 등록하면 중단 시점과 실행하는 과정 중에서의 값을 보여줍니다.
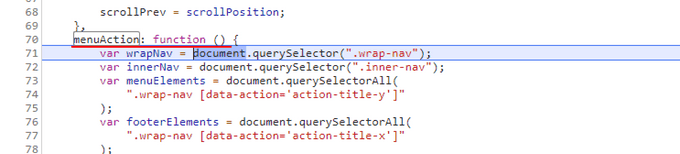
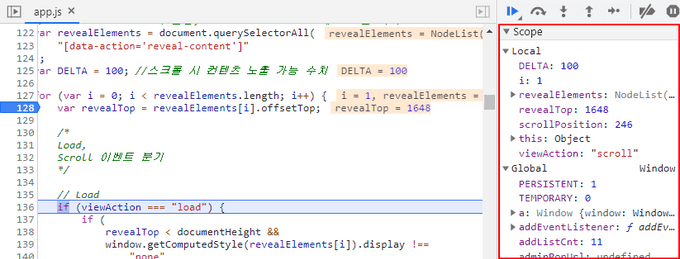
Scope
실행 시 정의되어있는 모든 변수의 값을 보여줍니다.
- Local: 함수의 지역 변수
- Global: 함수 바깥에 선언된 전역 변수
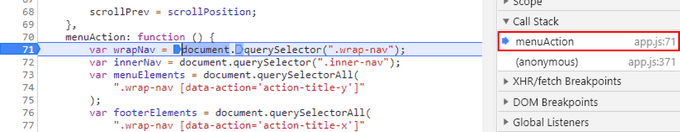
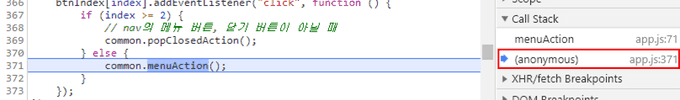
Call Stack
실행 경로를 역순으로 보여주며 해당 소스 클릭 시 그 코드로 이동할 수 있습니다.
마치며
브라우저 디버깅은 작업자가 코드를 한 줄 한 줄 실행해가면서 알고자 하는 것을 확인할 수 있는 점이 큰 장점입니다. 따라서 반복문이나 실시간으로 변화하는 값을 확인할 때 유용하였습니다. 대신 단순하고 직관적인 값(오류)을 확인할 때는 alert이나 console이 상대적으로 덜 번거롭게 느껴졌습니다.
여러가지 디버깅 방법을 활용하면서 오류로 보내는 시간을 줄여보아요.
고맙습니다. - 끄읕 -